Examining UCLA-UK by the Numbers
Share
Kentucky-UCLA comes rife with storylines, all of which will be explored in great detail when the two teams arrive in Memphis, Tennessee, to address what promises to be a massive media contingent.
Between the blueblooded nature of the two programs and the personalities involved, those storylines might even overshadow the game itself at times.
But when the Wildcats and Bruins take the floor, all that will melt away. What will be left is a basketball game between two very good teams with an Elite Eight trip on the line.
Let’s take a look at what we can expect, borrowing heavily from kenpom.com’s statistical analysis.
UCLA offense vs. Kentucky defense
UCLA is an offensive juggernaut, to put it plainly. The Bruins rank second in the country in adjusted offensive efficiency (126.1) and third among teams since the 2001-02 season. Only Oklahoma State this season and the 2014-15 version of Wisconsin outrank them. UK is an elite defensive team, but not historically so. The Cats are eighth nationally in adjusted defensive efficiency at 91.9.
UCLA excels, largely, on the strength of two things: excellent shooting (0.598 effective field-goal percentage) and superb turnover avoidance (0.150 turnover percentage). The Bruins rank first and ninth in the two measures, respectively, making them one of two teams in America to rank in the top 10 in both. UK, meanwhile, is merely good at defending opposing shooters and average at forcing turnovers, ranking 34th and 136th nationally.
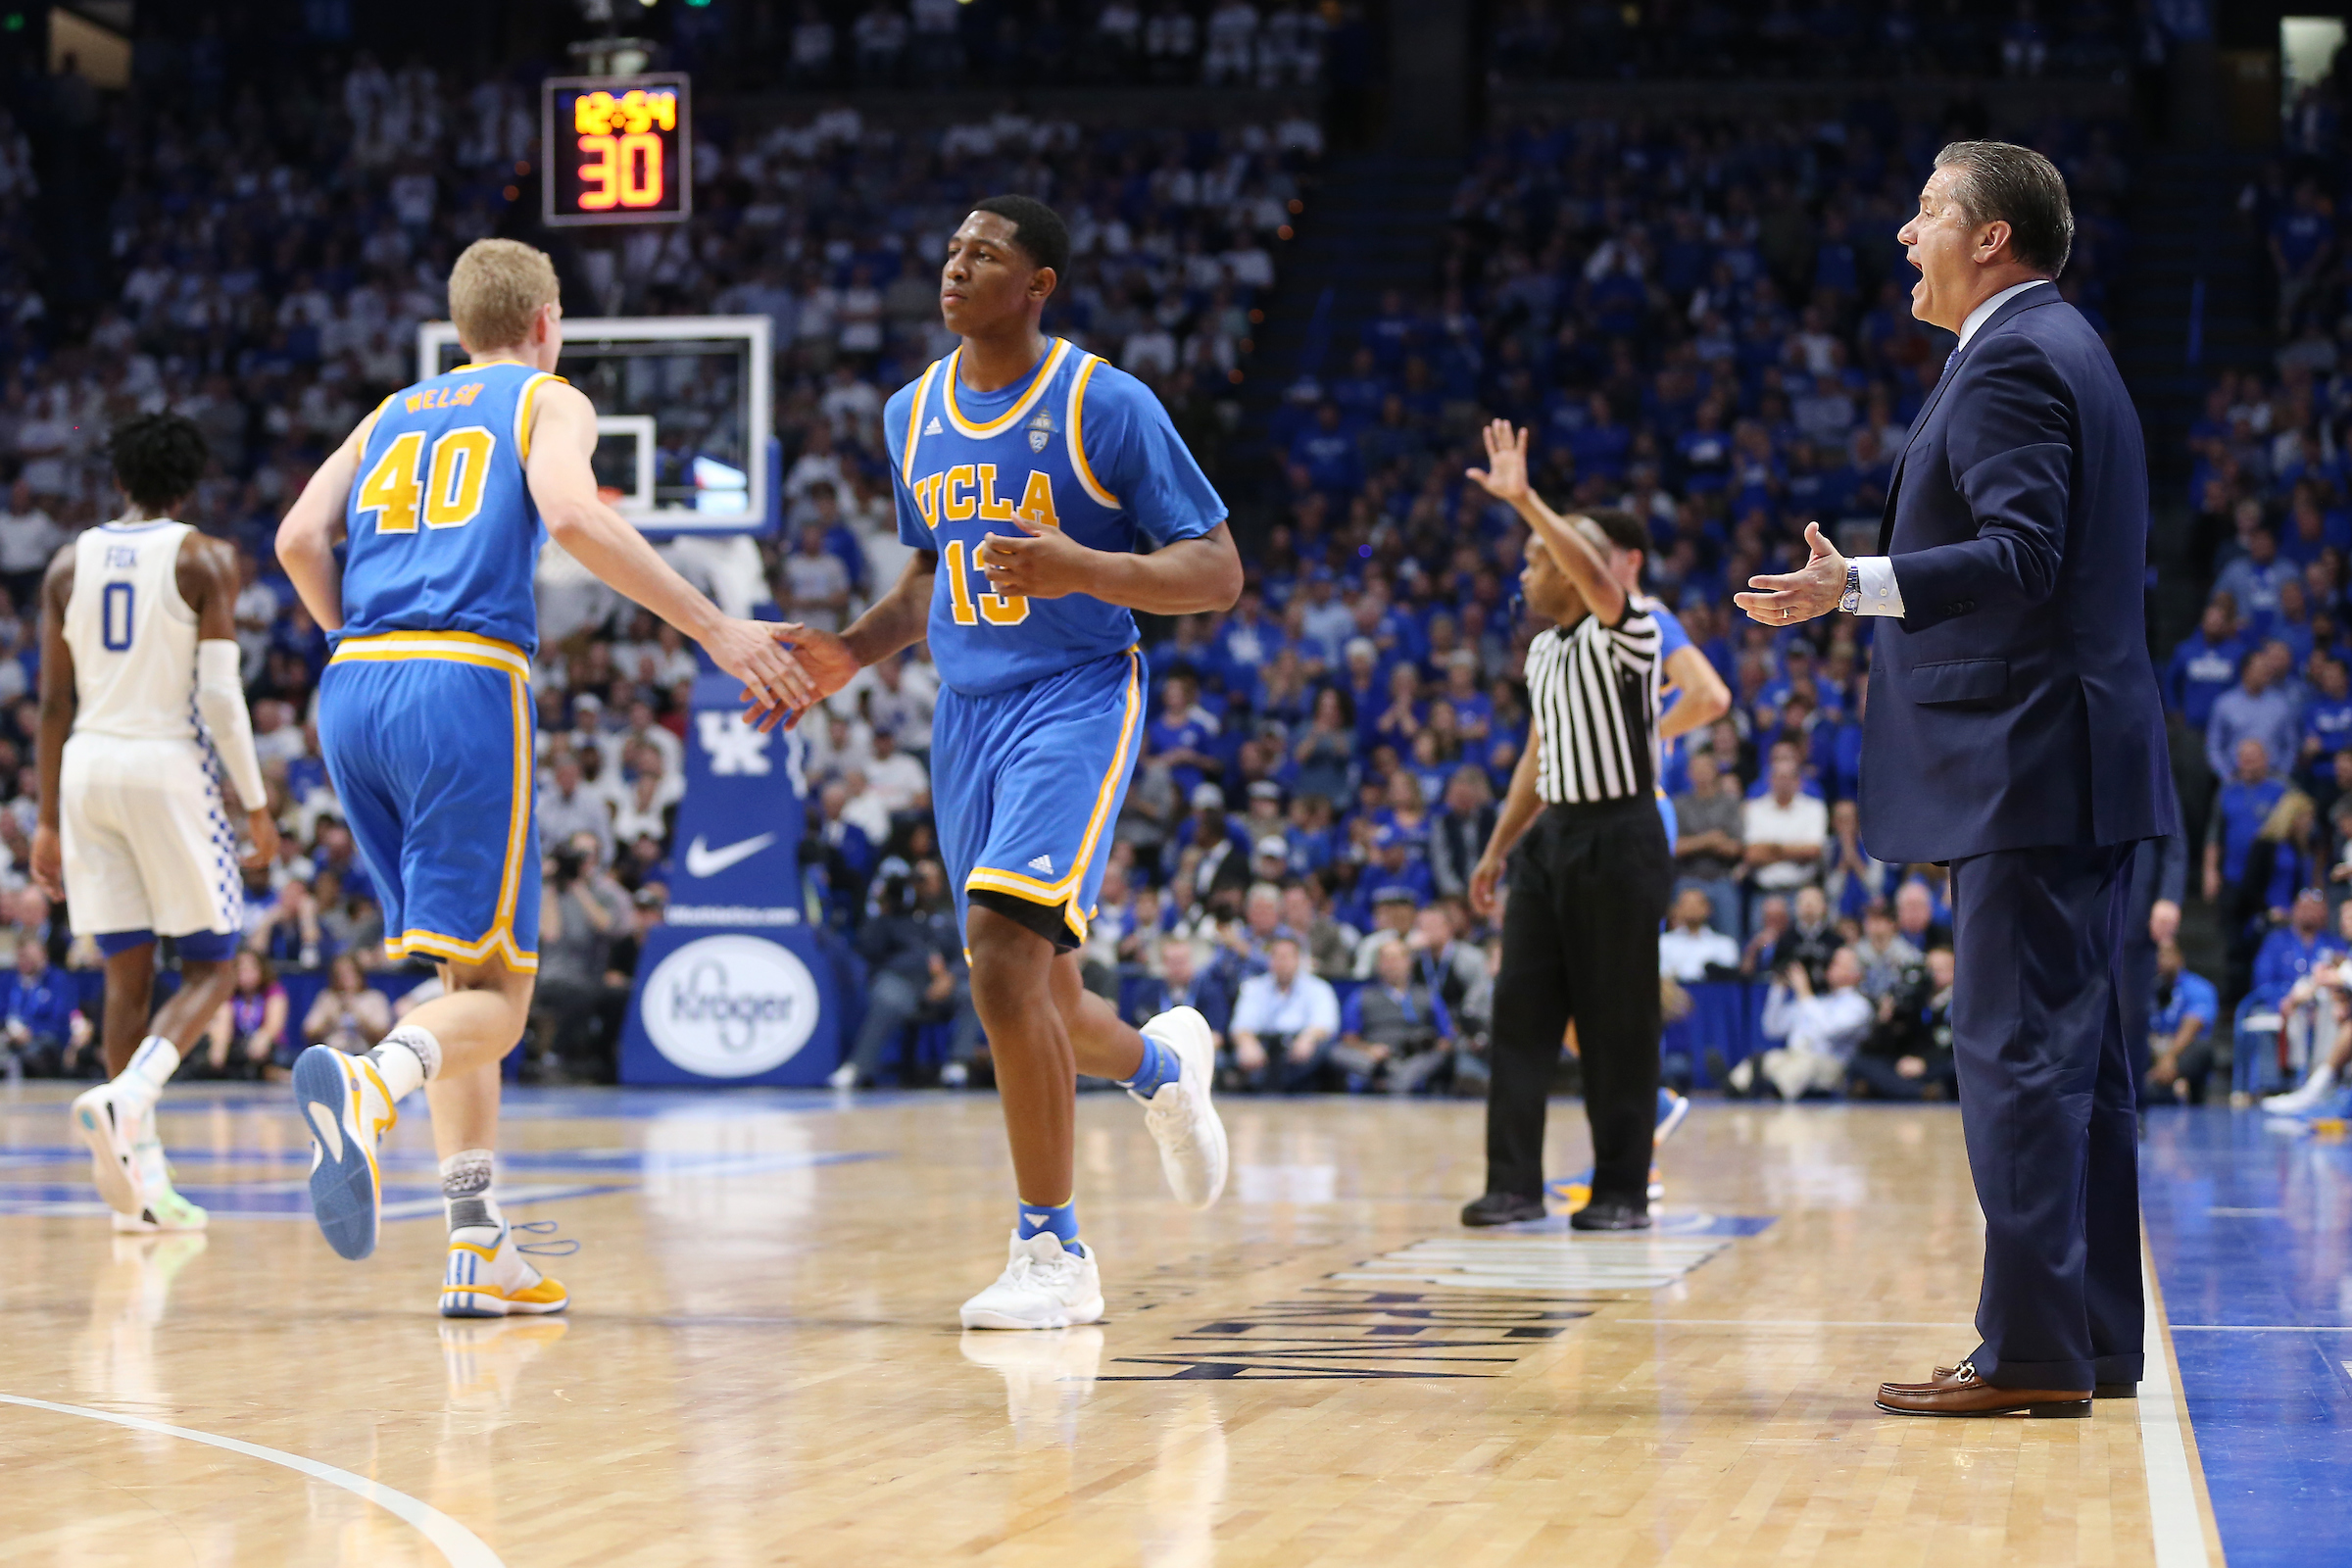
Interestingly, UK actually managed to force 18 turnovers in the first matchup between the two teams, a 97-92 defeat for the Wildcats. That resulted in a turnover percentage of 0.217, the second highest for the Bruins this season. They made up for it with an effective field-goal percentage of 0.61.
Where UK has the edge on defense (on paper anyway) is in rebounding UCLA misses and preventing free-throw attempts. The Cats, purely by the numbers, rank as John Calipari’s best defensive-rebounding team since the advent of kenpom.com, allowing opponents to grab only 27.4 percent of their misses, though that still only ranks 93rd nationally. UCLA, meanwhile, is a below-average offensive rebounding team, ranking 185th nationally in rebounding 29.1 percent of its own misses.
UCLA also gets to the free-throw line less than all but 10 teams in the country, ranking 341st nationally with a free-throw rate of 26.9. UK is slightly above average in the defensive version of that stat, ranking 134th nationally with a defensive free-throw rate of 33.5.
Long story short, the Cats aren’t likely to shut down UCLA. Neither are they likely to force Lonzo Ball and the Bruins into 18 more turnovers, particularly not after they had only three giveaways against Cincinnati in the second round. UK’s best chance to slow UCLA is probably by protecting the glass and keeping the Bruins off the free-throw line while limiting easy opportunities.
Kentucky offense vs. UCLA defense
Though it’s tough to stop the Bruins on offense, the Cats will have opportunities on the other end of the floor if they execute. Kentucky has the 13th-ranked unit in the country in offensive efficiency, while UCLA is ranked just 77th and allowing 1.02 points per possession.
For starters, it will be important for UK to capitalize on its statistical advantage in the turnover department. UCLA rarely forces turnovers (315th nationally in defensive turnover rate) and UK takes care of the ball well (24th nationally in offensive turnover rate). Those numbers bore themselves out in the December matchup between the two teams, with UK committing turnovers on just 10.8 percent of its possessions.
UK and UCLA are fairly well matched in effective field-goal percentage and free-throw rate, ranking within 20 spots of one another. Rebounding, however, may offer an opportunity for the Cats. UK is ranked 45th with an offensive-rebounding percentage of 0.337 and UCLA 145th in defensive-rebounding percentage at 0.715. UK capitalized on that in the first matchup, grabbing 19-of-49 (38.8 percent) available offensive rebounds.
Extra chances, in the form of turnover avoidance and offensive rebounds, is likely the path to an efficient offensive day for UK.
Style of play
The Cats and the Bruins both like to run, so run they surely will. UCLA is 14th nationally in adjusted tempo (72.8 possessions per game), UK 22nd (72.3 possessions per game). The first matchup featured 83 possessions, tied for a season high for UK.
What will be interesting to watch is how much the Cats, who have shown an improved ability to grind it out during their 13-game winning streak, slow UCLA down. UK surely won’t pass on opportunities to get De’Aaron Fox, Malik Monk and Isaiah Briscoe in the open floor, but it also doesn’t want to see Ball running wild.
Another thing to keep in mind is that UCLA plays one of the tightest rotations in the country, ranking 331st in minutes played by its bench. UK has condensed its rotation of late, but used the likes of Mychal Mulder and Isaac Humphries for extended stretches in a second-round win over Wichita State. There’s no guarantee this will be a factor, but foul trouble and fatigue could loom.
Finally, assists. With one of the nation’s best point guards leading the way, it should come as no surprise that UCLA is fifth in America in assist rate, with 63.9 percent of its baskets coming off assists. UK’s opponents on the season, meanwhile, have scored only 43.1 percent of their baskets off assists. The two teams essentially split the difference in the first matchup, with UCLA registering assists on 51.4 percent of its 35 baskets. If that percentage increases on Friday night, it’s advantage UCLA. If it decreases because UK forces the Bruins into more one-on-one play, the edge goes to the Cats.


